Friday, 27 November 2020

IPOs vs the virus

Some internet wandering led me to stumble on the following chart from PWC that left me a little dumbfounded, and prompted a stroll through some IPO facts and figures.


Who in their right minds would try to get their business listed on a stock exchange in the middle of a pandemic, and potentially in the teeth of a terrible recession? It turns out that 477 businesses did just that in Q3 this year, raising $116bn in the process.

According to EY “Q3 2020 was the most active third quarter in last 20 years by proceeds and the second highest third quarter by deal numbers”.

So where is this extravaganza of new listings? 23 of them turned up in London (details here at the LSE). The fun was mostly being had in the US. They were flying off the shelves at such a rate that the numbers are increasing by the day it seems. As of 24th November, 2020, according to stockanalysis.com: "There have been 401 IPOs on the US stock market this year, as of November 24, 2020. That is +81.4% more than the same time in 2019, which had 221 IPOs by this date."

Is there a spooky correlation between the number of people dying from respiratory illness and the volume of IPOs during the year? One for Tyler Vigen maybe...

Looking at that busy US IPO activity for 2019, (as at November 2020) 59% of the IPOs are higher than their initial listing price, 40% are lower. The top 10 are below:

IPO Date

Name

IPO Price

Current

Return

Apr 18, 2019

Zoom Video Communications

$36.00

$430.28

1095%

Jun 13, 2019

Fiverr International

$21.00

$200.00

852%

Oct 10, 2019

BioNTech SE

$15.00

$106.50

610%

Nov 21, 2019

SiTime

$13.00

$85.20

555%

Jun 28, 2019

Karuna Therapeutics

$16.00

$100.00

525%

Jun 6, 2019

GSX Techedu

$10.50

$63.90

509%

Mar 7, 2019

ShockWave Medical

$17.00

$98.64

480%

Apr 17, 2019

Turning Point Therapeutics

$18.00

$104.37

480%

May 2, 2019

Beyond Meat

$25.00

$140.96

464%

Dec 5, 2019

LMP Automotive Holdings

$5.00

$27.71

454%


The bottom 10 from 2019:

IPO Date

Name

IPO Price

Current

Return

Nov 8, 2019

ECMOHO Limited

$10.00

$1.43

-86%

Aug 15, 2019

9F Inc.

$9.50

$1.29

-86%

Feb 12, 2019

Anchiano Therapeutics

$11.50

$1.41

-88%

Nov 13, 2019

YayYo

$4.00

$0.4500

-89%

Feb 15, 2019

Stealth BioTherapeutics

$12.00

$1.30

-89%

Jul 31, 2019

Borr Drilling

$9.30

$0.800

-91%

Jan 4, 2019

China SXT Pharmaceuticals

$4.00

$0.290

-93%

Apr 5, 2019

Guardion Health Sciences

$4.00

$0.247

-94%

May 10, 2019

Sonim Technologies

$11.00

$0.585

-95%

Aug 1, 2019

Sundial Growers

$13.00

$0.241

-98%


2020 has been just as exciting. 61% of the new listing from this year are in the green, whilst 36% have lost money.

2020 top 10 IPOs:

IPO Date

Name

IPO Price

Current

Return

Aug 14, 2020

CureVac

$16.00

$85.06

432%

Aug 27, 2020

XPeng

$15.00

$72.17

381%

Apr 8, 2020

Keros Therapeutics

$16.00

$76.21

376%

Jul 17, 2020

ALX Oncology Holdings

$19.00

$82.28

333%

Feb 6, 2020

Schrodinger

$17.00

$67.65

298%

Jul 30, 2020

Li Auto

$11.50

$43.64

279%

Jul 17, 2020

Berkeley Lights

$22.00

$83.36

279%

May 22, 2020

Inari Medical

$19.00

$68.00

258%

Jun 5, 2020

Dada Nexus

$16.00

$52.03

225%

Aug 13, 2020

KE Holdings

$20.00

$62.97

215%


And the bottom 10:

IPO Date

Name

IPO Price

Current

Return

Feb 6, 2020

Casper Sleep

$12.00

$6.04

-50%

Jan 17, 2020

Velocity Financial

$13.00

$6.25

-52%

Sep 30, 2020

Boqii Holding

$10.00

$4.78

-52%

Feb 13, 2020

Muscle Maker

$5.00

$2.30

-54%

Feb 24, 2020

Zhongchao

$4.00

$1.82

-55%

Jan 30, 2020

AnPac Bio-Medical Science

$12.00

$3.49

-71%

Jan 17, 2020

Phoenix Tree Holdings

$13.50

$3.76

-72%

Jun 19, 2020

Progenity

$15.00

$3.64

-76%

Jan 17, 2020

Lizhi Inc.

$11.00

$2.48

-77%

Jun 30, 2020

Aditx Therapeutics

$9.00

$1.91

-79%


Exciting stuff, a bit racy for me.

The requirements for a new listing vary slightly from one exchange to another, as do the regulatory requirements. The LSE have a nice write up here and nicely summarised below. 


It all sounds like a nice wheeze to get some cash, perhaps the founders have the chance to offload some of their own investment tied up in the company. But a more sobering element is the cost. PWC again have a nice tool to allow a view of the potential costs.

As an example, a tech firm with revenues less than $100m wanting to list at a valuation in the range of $100m to $250m would end up having to hand over between $8m to $24m according to PWC. 


Some of these IPOs are SPACs - Special Purpose Acquisition Companies. There is a detailed and comprehensive write up from Harvard if these excite you. SPACs are companies with no commercial operations that are designed and built just to raise capital via an IPO. It then buys an existing business. They are known as "blank cheque" companies and have been around for decades, but the recent boom in IPOs have brought these to the public attention through some high profile listings.

I think IPOs are not for me, although one or two of the US businesses do look interesting. I prefer my investments to be a little less volatile.

Saturday, 7 November 2020

October 2020 portfolio update

A wobbly set of markets in October. Not quite collapsing, but looking like they were considering it. Most markets drifted from green to red over the course of the month. In addition to the virus, in the UK Brexit headlines had Sterling whizzing around which tends to impact the overseas earners on the FTSE. 

Virus news continued to deteriorate across Europe and the US, with the predictions for a tough winter playing out. As health systems started to get stretched more restrictive social distancing measures were deployed. I get the impression many people are now suffering some fatigue from this, and can't wait to get out, even the morning commute is starting to look appealing to me.

The two elderly US gents vying to run their country managed to continue to squabble over social media, and just about managed a civilised second debate. The Trump team have publicly announced that they have given up trying to control the virus. Perhaps of no surprise is that the blue and red teams couldn’t agree on any more economic support for the country until the election is out of the way. Can a country of 330m people really not do better than these two? Ah well it will be over soon…maybe.

The portfolio stumbled this month, along with the wider markets. October brings to an end a nice run of monthly increases over the last 7 months, which equalled it's previous best run.

Portfolio performance
The portfolio was down -3.3% in October, ahead of my chosen benchmark (Vanguard FTSE All Share Accumulation) which was down -3.8% over the same period.

Best performers this month:
Dignity +23%
Abcam +20%
SAGA +10%

Worst performers this month:
Qinetiq -15%
Sage Group -12%
RELX -12%

October share purchase 1: RWS
RWS provide a range of highly technical translation services. Their business is divided into 4 segments:

  • IP Services: patent translations/ filing/ research
  • Life Sciences: language solutions for clinical trials and other aspects of technical support
  • Moravia: localisation of products and content for international businesses
  • Language Solutions: translation and interpretation services

They were listed in 2003, and have continually grown and developed their business both organically and through acquisitions. Earlier in the year RWS announced a merger with fellow translation firm SDL which specialises in AI based translation services. It follows acquisitions of various technology based firms over previous years, and now puts RWS as the market leader in the field. Following Terry Smith’s advice I decided to invest in RWS not because they might be the next big winner, but because they have already won.

RWS started life as translation firm Randall Woolcott Services. The Chairman, Andrew Brode bought the company along with 3i in 1995 and currently owns over 30% of the shares. He seems to have been doing something right as over the past 10 years, net margins and return on capital have both averaged in the mid-teens. Dividends have increased each year, at a compound rate of over 10%, and is currently covered more than 2.5x cash flow.

Their competitive advantage comes through providing highly technical and niche expertise, which increases client dependence on RWS. The acquisition of SDL cements their market leading position and increases scope for dominant pricing power. I prefer defensive companies, and suspect that RWS falls into this categorisation. Although clients will likely reduce discretionary spend during economic downturns, the critical and highly technical nature of RWS services should make for dependable income irrespective of macro-economic issues.

I see the main risks to RWS being the development of AI to provide such sophisticated translation and localisation services that the likes of RWS become superfluous. This is why RWS have been making their recent acquisitions, to ensure that they are part of the development of this AI. Over time we shall see how things pan out.


October share purchase 2: IHR
The second purchase this month was a small investment in Impact Healthcare REIT, this business owns real estate that is leased to care home providers. The trust has over 100 properties that are used by 11 different care home operators, with the rental income being split 3 ways - 60% from local authorities, 30% from private firms and 10% from the NHS.

Despite the COVID-19 disruptions the trust has collected all of it's rental income for the year to date, and has continued to pay dividends. Loan to value stands at 18%, and the weighted average lease is getting on for 20 years. The trust has been quietly improving on it's portfolio over the year, which is a trait I'm looking for at the moment - businesses that continue to operate relatively normally, not crippled by the pandemic.

The share price is down around 10% since the start of the year and I might well add to this holding if it stays that way. The risks of doing so would include changes to government policy over care home funding, and the care home providers needing to protect their occupants from the virus until we have better medical treatments available.

Sunday, 1 November 2020

All weather portfolio

The All Weather Portfolio was the brainchild of Ray Dalio and his pals at Bridgewater which was eventually put to use in the 1990's. The history behind their thinking can be found here. As the name suggests the idea behind the portfolio construction was to build a fund that could generate returns in any economic environment. And looking at some basic stats it has done just that, and has a CAGR of around 7% since 2007.

The foundation of the portfolio was the notion that there are a limited number of factors driving returns in various asset classes. This was boiled down to 4 economic environments, a growing or shrinking economy, and rising or falling inflation as shown below:


And the idea that various asset classes outperformed in those different growth and/ or inflation environments:


However it wasn't simply a judgement of where to find the best returns, the All Weather portfolio was a risk parity portfolio. To this end the construction of the portfolio was designed such that each asset class was limited to the same amount of risk. Using the 4 environments above the portfolio was built such that there was an equal risk distributed across the different environments and the returns that each asset class would provide.

Risk, as I discussed in a previous post is a slippery notion in investing. But within the context of the All Weather portfolio, risk is viewed as volatility, and the portfolio is designed to reduce this whilst maintaining a steady return.

The exact contents of the Bridgewater portfolio is understandably kept under wraps. However, in an interview with self-help guru Tony Robbins, Dalio revealed the outline of the fund. It is roughly:

  • 40% long-term bonds
  • 30% stocks
  • 15% intermediate-term bonds
  • 7.5% gold
  • 7.5% commodities

So armed with this information, using readily available investments one could recreate an approximation of the Bridgewater All Weather portfolio. And using the excellent portfoliovizualiser site, as noted above, we can see that using the above allocations, the portfolio seems to have performed pretty well, generating a reasonable 7% CAGR with a relatively low degree of volatility.

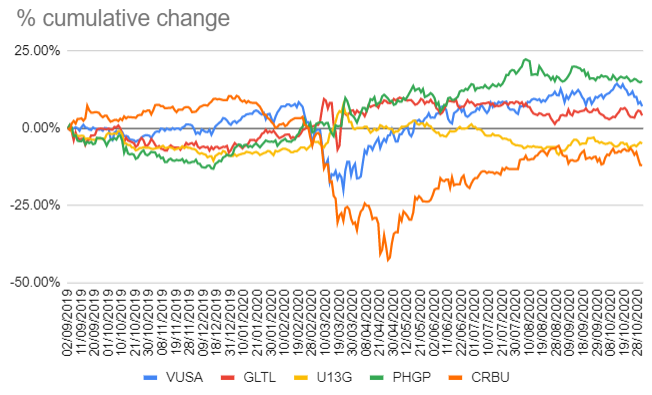
I decided to play around in googlesheets to try out a version of the portfolio with a few funds that seemed to cover off the main asset classes:

  • 40% long-term bonds: SPDR Barclays 15+ Year Gilt UCITS ETF (GLTL)
  • 30% stocks: S&P 500 UCITS ETF (VUSA)
  • 15% intermediate-term bonds: Lyxor iBoxx $ Treasuries 1-3yr UCITS ETF (U13G)
  • 7.5% gold: WisdomTree Physical Gold (PHGP)
  • 7.5% commodities: Lyxor Commodities Thomson Reuters/CoreCommodity CRB (CRBU)

Feel free to download a copy of the spreadsheet and play around with the funds. I've not spent a lot of time trying to pick the best or cheapest funds so there may well be better alternatives out there.

One of the attractions of the portfolio is that it removes the need for market timing, whenever you start should make no difference. So I took data from around a year ago, as this would include the bull run in equities at the end of 2019, and the impact of the pandemic during 2020 (September 2019 - October 2020). During this period we can see that the different investment funds had a relatively limited range of diversion up until the pandemic hit the headlines, at which point, their reactions diverged considerably.

Example all weather portfolio

The overall performance of the portfolio assuming the above construction is below:

Example all weather porfolio performance

It held up pretty well, doing what it was designed to do I guess.

This type of investment does interest me, the last month at work has been crazy busy, (with this post stuck in draft for the past couple of weeks😴) and the idea of having a basket of investments that doesn't need much TLC other than an occasional rebalance certainly appeals. I enjoy the analysis and investigation of individual companies, and so far my own investments are doing ok. But should life get in the way of the investing process, I'd be quite happy to switch over to this sort of investing instead.

Friday, 2 October 2020

September 2020 portfolio update

September in the markets felt like a bit of a tease, a mix of selling and a threat of a significant fall, on other days there was a jump higher. A number of the big US tech firms saw their shares getting sold off, perhaps unsurprisingly given the journey they've been on since March. It was a bit more sedate in Blighty, the FTSE drifting gently lower.

Virus news worsened over the month with increased spread across the country, and with it came the risk of more restrictive social distancing. The US election got up to full steam, with Biden and Trump on a live "debate" - looked to me like two daft old men bickering. And in case that wasn't entertaining enough Brexit is back with a vengeance. Come to think of it, I'm surprised the markets haven't completely collapsed under all that nonsense.

No new additions to the portfolio this month, although an old-timer was topped up. And there is now one less holding, after waving goodbye to Network International.

Portfolio performance
The portfolio was up +2.1% in September, ahead of my chosen benchmark (Vanguard FTSE All Share Accumulation) which was down -1.7% over the same period.

Best performers this month:
888 Holdings +27%
Somero Enterprises +24%
Fulcrum Utilities +20%

Worst performers this month:
Dignity -21%
Craneware -10%
Eleco -10%

September share sale: NETW
Network International is a provider of payment services, focussed mainly on the Middle East. I bought into this in August 2019, after it's IPO in April 2019. This proved to be counter to my usual purchase targets, which are typically businesses that have been publicly listed for a while, and have demonstrated some degree of resilience over the past few years.

The main box ticking that NETW provided was that under "normal" circumstances - i.e. when we're not in the middle of a global pandemic - payment providers should be a pretty defensive business. People will buy stuff, no matter what. Exactly what they buy will change, but there will be a sustained requirement for a mechanism to pay. What it didn't have was a history as a publicly traded business, this deviation from my usual practice left me feeling a little uncomfortable when COVID-19 hit as I didn't have my usual research and business history to fall back on.

What really took the biscuit, however, was the share price getting cut in half on no news. Directors then made comforting statements, and bought some shares, pushing the price back up as dramatically as it fell. But I can't help wondering.... It reminded me of NMC, Finablr and Wirecard. Rather than wait this one out, I decided to sell at a 40% loss. I'd rather have that money invested in something else that I feel more comfortable with. Thankfully my approach to riskier investments meant I'd kept the amount invested small.

September share purchase: GSK
I've held shares in GlaxoSmithKline (GSK) for a while, I quite like buying shares in companies whose products are found in my house, toothpastes or painkillers, for example. They also have a range of pharmaceutical products, and vaccines. They've been in the news a fair bit recently, as has every other pharma business, trying to develop vaccines for COVID-19.

I'm less concerned about whether they cross the finish line in the race for the first COVID-19 vaccine, I'm invested because I suspect there will be a relatively stable demand for GSK products. As a pharma business, it has to run just to stand still, as there is a constant patent cliff edge over which it's products fall. Once they do, generic medicines can be spun up at much lower prices, and assuming they do the job, why pay for the more expensive brands. It also has a consumer healthcare arm which is a much less demanding part of the business.

GSK has merged it's healthcare business with that of Pfizer, which could be spun out as a separate company. It provides a tempting investment as it now comprises a huge over the counter healthcare business, that is likely to be more profitable and easier to manage than a pharmaceutical company. No specific news has been issued on this recently, but I'm content to wait and enjoy the ride.

Glaxo has a decent dividend at around 5%, and has been rebuilding it's dividend cover whilst holding the payment flat over the past few years. As of last year it was covered around 1.7x by free cash flow. The vaccines business has taken a bit of a hit this year, with fewer vaccinations due to healthcare systems being overwhelmed by COVID-19, but hopefully this will have recovered somewhat during the back end of the year.

Tuesday, 15 September 2020

Solar power investments - 2nd thoughts

Solar power has been a phenomenal success. It's increasing adoption is driving down costs, and generating increasingly cheap electricity. Here is an article that spells this out in convincing detail.

This article from the IEA is suggestive of something similar, although from the point of view of auctions. And this from Irena, suggesting the costs from Solar have been reducing by around 13% per year.

I think the greatest impediment to further adoption of renewables over fossil fuel has been economics. It seems clear that in the case of solar this argument has been won. Solar provides increasingly cheap, cost effective electricity.

Solar investments
I have two investments in solar power in my portfolio, Next Energy Solar Fund (NESF) and Foresight Solar Fund (FSFL). In both cases I assumed these would offer relatively little in the way of capital growth, but that the pedestrian growth will be augmented by a steady flow of dividends. And since the power that these businesses generate gradually increases in price over time, the dividends will more or less keep pace with that level of price inflation.

However, as noted above, solar energy price inflation may not be forthcoming. Quite the opposite. Next Energy Solar recently published their annual report so I was intrigued to read about how they intend to manage a product reducing in price.

Next Energy Solar Fund (NESF)

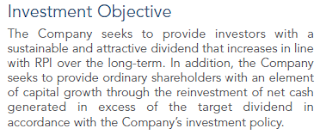
I bought shares in Next Energy Solar Fund (NESF) in November 2019, essentially buying into their investment objective as outlined in their 2019 annual report:

I expected it would reduce the volatility of my portfolio, as it should have steady revenue streams, most of which were backed by Government subsidy. And one reason I like dividends is that they too help reduce portfolio volatility. So it was a typical risk/ reward trade off - lower growth and lower volatility. The KIID implied as much.

At the time 35% - 40% of NESF revenue was not covered by some form of subsidy, and more subsidy free solar development was underway. So this chunk of subsidy free electricity would be subject to the movement of prices on the wider wholesale energy market.

The annual report describes the fund's NAV increasing over 2019 for various reasons, including "...upwards revisions in the forecasts for long-term power prices...". Happy days, unless those power prices go the other way...

Next Energy 2020
I like reading annual reports - it is the chance for the business to put itself in the shop window, and tell the best version of it's story. It is also a more rounded story, with a little more meat than the simple results briefing. It should be convincing, so when it isn't I find it worrisome.

The NESF results weren't great, but not disastrous. NAV down a bit, dividends up a bit. Operationally there were more assets generating more electricity, and a higher capacity. But the Chairman's statement contained the following:


"...power prices and inflation levels have become less correlated..." - which rather matches some of the analysis from the articles linked above. And as a result RPI linked dividends are out of the window, the resulting change to NESF's investment objective has since become "regular dividends":


Subsidy free risk
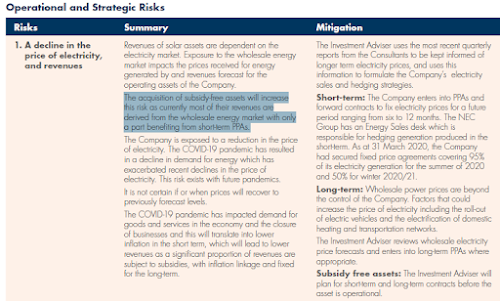
The top "Operational and Strategic Risk" highlighted in the annual report relates to the risk of falling electricity prices: "The acquisition of subsidy-free assets will increase this risk as currently most of their revenues are derived from the wholesale energy market with only a part benefiting from short-term PPAs."

The Chairman acknowledges that 39% of their revenues are without subsidy, and require locking in prices using PPAs:


And that they continue to pursue a subsidy free investment programme, aiming for 150MW by the end of 2020, at a cost of £55m - £80m. Preference shares worth £100m were issued during the year, which I guess is the source of the majority of this cash.

Discount rate
The final bit of irritation was found in their financial KPIs, 

Each year since 2017, the discount rate has been reduced. Since this sits in the denominator of the discounted cash flow they will be using to calculate the NAV, it has the effect of increasing the NAV. Which is mentioned in the discussion of NAV in the annual report:


Unfortunately NESF don't state how they determine the discount rate.

Conclusion
It feels to me as if the business has backed itself into a corner. It's only route to growth being the purchase and development of assets that are generating a product being sold for an ever decreasing profit. Continuing to increase the proportion of subsidy free assets in their portfolio surely can't be sensible, as indicated by their own risk assessment.

Changes to the discount rate have been made without explanation, and since doing this cushions the impact of the falling price of their product, it's not a good look.

I should have identified some of this in my research before purchase. Lesson learnt.


Thursday, 3 September 2020

August 2020 portfolio update

August proved to be a fairly uneventful month in the markets, UK markets going sideways and most others chugging North. US tech continues to eat the world and now a small handful of these companies are worth more than all European listed companies. I wonder what will happen when the tech giants' share prices fall over?

At least the drip feed of hopeful news on COVID-19 treatments continues, as does the search for a vaccine. Hopefully the mask will be to COVID-19 what the condom was to HIV, my ventures into public spaces recently have been filled with a mask wearing public. I even saw a TV advert for the fashion conscious mask wearer the other day.

I've been having a ponder about the portfolio, and there are a couple of changes I think I'd like to make over the next few months. Following some more research, and release of info from a couple of holdings, I'm less keen on keeping hold of them, so potentially a couple of sales required. On the buying front, I'm curious to see what will sell off during the next drop - will the shares already hurt go much lower, or will it be those that have held up well that are in the firing line? 

Portfolio performance
The portfolio was up +1.2% in August, behind my chosen benchmark (Vanguard FTSE All Share Accumulation) which was up +2.4% over the same period.

Best performers this month:
Dignity +65%
Compass +16%
Elco +13%

Worst performers this month:
Somero Enterprises -12%
Saga -10%
Network International -7%

August share purchase: REL
RELX (REL) was added to the portfolio in August. I'm rather pleased about this as it's a company I've been following for a while, but the price never seemed to fall too far when the market wobbled. So I thought I should take the opportunity when the price dropped earlier in the month.

RELX has it's roots in publishing, in particular, scientific, technical and medical material, and legal textbooks. It was formed from a merger of two publishers, one British: Reed International, and one Dutch: Elsevier. It has been listed on the London Stock Exchange in some form since 1948, and over the past few decades has grown to a market cap of around £33bn.

RELX now make relatively little from paper publishing, only around 9% of revenue is from print. Today the company, in their own words: "...is a global provider of information-based analytics and decision tools for professional and business customers". They have 4 segments in the business: Scientific/Technical/Medical, Risk/Business Analytics, Legal, Exhibitions. The first 3 segments provide data and analytics technologies to a range of industries, from life sciences, fraud detection, and case law. The 4th segment - Exhibitions - is a bit of an awkward fit with the rest of the business, and the reason that I think the price tumbled. More on this below.

The interim results announced at the end of July told of the 3 data and analytics segments of the business holding up well under the pressures of COVID-19, and even growing. However the Exhibitions have been whacked by the virus - getting large groups of people together to try to sell each other stuff isn't a great idea at present. This part of the business generated around 16% of revenues last year, which was roughly the discount on the price from the start of the year at which I managed to pick up the shares. Face to face business clearly isn't going to happen for a while, so this part of the business is likely to continue to struggle, but so long as the other segments hold up RELX shouldn't be in an too much bother.

According to their annual report RELX are in the top 1 or 2 position in the various markets in which they operate. Their "moat" has been built over many years, RELX has developed sophisticated databases and decision-making tools that many industries and professions now heavily rely on to carry out their daily activities. The majority of their revenues are subscriptions, which is preferable in my view - they tend to be sticky and give visibility of future earnings. Their Return on Capital has averaged over 15% and net margins over 17% over the past 10 years, which combined with relatively light capital requirements have led to healthy cash flows. These have covered the dividend more than 2x over the past few years. 

It's not all silver linings of course, on the cloud front, they have more debt than I would like. Should the data that RELX provides become more accessible in the public domain, or author/reader payment models change, this could give them a headache.

Thursday, 27 August 2020

The Volatility Index - VIX

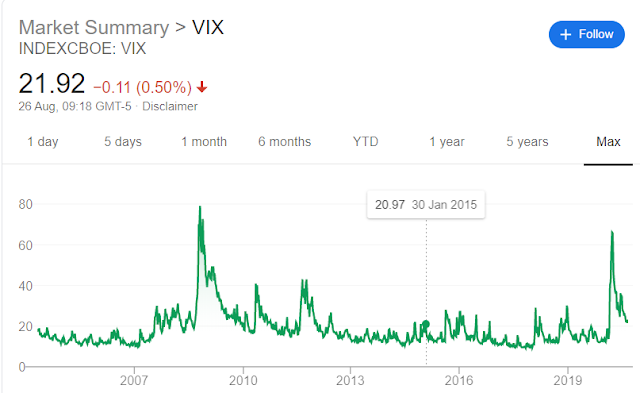
Advice from Warren Buffett includes being greedy when others are fearful. So something known as the stock market’s “Fear Gauge” is probably worth keeping an eye on. This gauge is the Volatility Index, the VIX.

VIX screenshot


The short version of the VIX, is that it is a barometer of expected market volatility based on S&P500 options pricing over the next 30 days. This information is condensed into a single number, which tends to spike upwards when the markets get volatile and unstable.

The VIX was created by the Chicago Board Options Exchange (CBOE) in 1993. It’s initial formulation was based on S&P100 options pricing. In 2003 it was revamped to be based on the S&P500, and tweaked again in 2014 to provide the version of the VIX used today. The CBOE have a white paper describing the VIX calculation and step by step guide here.

As usual there is a bit of unpacking required to really start to get understand what the VIX tells us.

 Options

Options are a way of protecting investments from the movements of the market. Purchasing an option gives the holder the right to buy or sell an investment at a pre-agreed price – no matter what price the market currently has for that investment.

“Calls” and “puts” each can be used to protect from price increases or decreases. A “call” is used to buy at a pre-agreed price, so the holder of a call option is protected against the price of an investment increasing, which would allow them to buy at a price lower than the market. A “put” is used to sell at a pre-agreed price, so the holder of a put option is protected against the price of an investment reducing and allows them to sell at a price that is higher than the market price. Each option has a lifespan, after it’s expiry the option cannot be used.

Of course the protection offered by options comes at a price, and the demand for protection drives that price. If there is widely held view that the price of a certain share is likely to drop significantly then the cost of taking out insurance against that fall though buying put options is likely to increase. 

Those option price movements reflect the anticipated movement of the underlying share prices. Using the analogy of an insurance premium, if two very similar people are paying very different amounts for their car insurance, the difference in price is likely to reflect the risk perceived by the insurance underwriter. In other words, price can be used as a proxy for risk.

The price of options and the movements of those prices are what drives the VIX. The options in question are those which relate to the price movements of the S&P500 expiring in around 30 days (specifically between 23 and 37 days in the future). As people buy and sell options the prices move, the more they move, the more the VIX will increase. The VIX takes an average of these movements and condenses these into a single number.

Volatility

According to the VIX white paper: “the VIX index measures 30 day expected volatility of the S&P500 index”. The volatility is the price movements of S&P500 options, which represents a crowd-sourced indication of the belief that the S&P will increase or decrease in value at various points in time in the next 30 days. Although the VIX is described as the “fear gauge” it is not simply falling prices that drive the VIX, upwards price movements also contribute. It is also not historic, but future, predicted movements that drive it – also known as “implied” volatility. For once statistics has a useful term to describe this – the variance of the prices, both up and down, from an average. The wider this variance gets, the lower the certainty over where markets are headed, and the higher the VIX will be.

Interpretation

The relation between the S&P and the VIX can easily be seen in a few charts here via googlesheets, it shows the S&P500 and VIX values over 3 different time-frames, and a scatter-plot of the same. The trend line of the scatter-plots shows a clear negative correlation between the two. Below is an example of the data from 2005 to 2020:

VIX and S&P500 scatter plot 2005 - 2020
VIX and S&P500 2005 - 2020

As noted above the VIX is a statistical representation of the prices for S&P500 options, more specifically percentage price movements. It is a figure that is annualised - meaning it represents a range of variability for the next year. So if the VIX is at 20, it indicates that the S&P500 is expected to see a range + or - 20% from it's current point over the next year... most of the time. "Most of the time" here is specifically 68% of the time - this is due to some of the stats in the calculation (it represents one standard deviation). If we are to believe the stats, then for the other 32% of the time we should expect the index to be trading outside of this range.

So as we can see, when the VIX spiked up to over 80 in March, this effectively says that we collectively had no idea where the market was headed. The complete lack of certainty had people buying and selling insurance premiums like crazy, forcing the VIX higher. Over the 6 months since then, as people have become more comfortable, the demand for insurance in the form of options has eased off, and so has the VIX.

As a non-trader my interest in the VIX is rather academic, but it is a fascinating construct. I suspect it won't remain dormant for long given the multiple market risks on the horizon...

Sunday, 2 August 2020

July 2020 portfolio update

I find watching the virus headlines come and go a bit dizzying after a while. But hearing Google pronounce that they don't expect to get people back into the office for another 12 months got my attention. 12 months...?

Over the last month US stocks have been pushed up by the trillion dollar tech companies, elsewhere they have been down. Europe saw spread of the virus start to pick up after it's lock-down, and the US saw it's cases explode. Probably a useful experiment as to the effects of not implementing adequate social distancing. This, plus an increasingly creaky relationship with China, and an election in a few months has seen the Dollar weaken. Trumpy went particularly strange at the end of the month deciding that the November election (the one that hasn't happened yet) won't be legit thanks to voter fraud...

There has been a bit of movement in share prices as businesses have delivered trading updates, which has resulted in some of those on my shopping list getting back to more inviting prices. A few companies have demonstrated a great deal of resilience. Good companies temporarily having a bad time could be a great investment, providing those tough times reverse before any long term damage is caused. Those companies showing resilience - these are the businesses I really want to own, but their prices are high... For this month, nothing too exciting I've topped up the Asian investment trust I bought into in June.

Portfolio performance
The portfolio was up +1.3% in July, ahead of my chosen benchmark (Vanguard FTSE All Share Accumulation) which was down -3.6% over the same period.

Best performers this month:
Dignity +31%
Computacenter +21%
Somero Enterprises +10%

Worst performers this month:
Fulcrum Utilities -12%
National Grid -9%
Glaxosmithkline -7%

July share purchase: HFEL
A top up of Henderson Far East Income Investment Trust (HFEL) was the only activity for the portfolio this month. I bought into this last month - there a few details on HFEL in my June update.

The Trust increased it's quarterly dividend by around 1.5%. In "normal" times this wouldn't get much attention but given the current environment it did cause one of my eyebrows to raise. The argument from the Trust is that most Asian economies went into the COVID-19 crisis healthy, and has managed it's response relatively well, so they expect them to come out in better shape than most other areas. And the specific companies in which they are invested have decent cash flow so should see relatively limited damage to dividend payments. There are around 9 months of reserves that the Trust can use to cover any shortfall and smooth out the dividend payments. I would have preferred them to err further towards caution and not increase the dividend, instead building up the reserves, which could then contribute to more aggressive increases on the other side of COVID-19 if they weren't needed.

However, the confidence of the Trust's Board and managers that they could at least continue the current dividend payments were enough to encourage a top up. I do wonder if this is a little bit of marketing, trying to pinch a few customers of other income based Trusts that may have a tougher time with dividends, time will tell.

Saturday, 11 July 2020

2020 Mid-year review

Portfolio review Jan - June 2020

Half way through 2020, it's been a hectic year in the markets, so lets see how the portfolio got on. My goals haven't changed:
  • Don't lose money
  • Increase capital by more than the rate of inflation
  • Build a conservative dividend paying portfolio
Through doing the above, I will hopefully also outperform the FTSE All Share Index. I have chosen the FTSE All Share as a benchmark as it most closely matches the pool of companies from which I’m investing. If I start picking stocks from elsewhere, then I might have to change, but it's good enough for now. I'll take a quick look at each of my stated goals to see how things are looking so far this year for the whole portfolio then pull out a couple of points of interest to see which investments were moving the dials.

Don't lose money
The portfolio remains in the green, as do profits, but it hasn't been a comfortable ride in the first half of the year. Excluding new cash invested, you can see below how both the portfolio measured up against my benchmark from January to June.

2020 porfolio performance
The portfolio at the half year mark was roughly 6% below where it was in January, compared to a drop of 17% for the benchmark. It might seem strange to hear that I'm quite pleased by losing 6% over the course of 6 months, but I'm trying to build a resilient portfolio, and by comparison to my benchmark I've not done too badly. My investments fell far less than the wider market, but as that elastic has become stretched, the market is bouncing back quicker than my portfolio. I'm quite content with my investments being less volatile that the market as recovering from large falls in value may take longer than expected.

Increase capital by more than the rate of inflation
On a 6 month timescale this clearly didn't happen, the Office For National Statistics latest inflation stats show it as 0.7%, versus a 6% portfolio fall, so we'll have to see if I can claw that back in the second half of the year. We might well end up with some deflation, if so I could sneak through on a technicality... Essentially this goal is to make sure I'm gaining in real terms, accounting for inflation, so a 6 month timescale is too short a measure to be useful

Build a conservative dividend paying portfolio
Over the past few years big blue chip stocks in the FTSE have provided limited capital growth, instead returning excess cash to investors as dividends. This came to an abrupt halt in 2020 as most companies looked to preserve cash to get them through the various lockdowns happening across the planet. My 15 core portfolio holdings were not immune to this, with 4 of them not paying a dividend in the first half of the year. The language used to describe the lack of dividends varied across the businesses concerned, so we'll have to wait and see if the businesses needed this cash, if they can sensibly invest it or it gets paid out in dividends at a later date. 

My preferred measure of the portfolio dividend yield is a rolling 12 month average yield, this has dropped back a bit since the start of the year, from 2.8% to 2.4%, which reflects both a slight reduction in dividend payments, and increased value of the portfolio. My investments are (mostly) in sensibly run, and conservative businesses that I expect to continue to pay out dividends once the current disruption is behind us. Given the axe taken to dividends over this year, I'll consider my dividend receipts a win so far.

Reflections on volatility
I was a little surprised that I was relatively sanguine during the worst of the market collapse. I admit I thought we were going to see the market drop by around 50%, so it faired better than I expected. When it looked like COVID-19 had moved beyond China, I paused my stock buying - in February it looked like the markets were in trouble. This proved to be a good move. I also didn't buy during the March collapse as I was trying to work out which businesses on my shopping list would be hit hard by the virus and/or lockdown measures, and which might be resilient. Not buying in March proved to be incorrect. Although I didn't suffer an immediate loss in Feb, I would have benefited from buying as the markets bottomed in March.  

Porfolio winners and losers
One of my core holdings, Compass, has been hit hard by the lockdowns. It provides catering services and since most events and companies have been either closed or happening virtually, demand for catering took a big hit. Trading updates indicated that around 50% of the business was closed. I'm comfortable staying invested, with the assumption that their scale will be a benefit over the long term. 

The contribution that each of the portfolio has made to the first half results is below:
Portfolio contributions to result

Compass is the clear outlier dragging down performance significantly. This is partly due to the fall in share price, but also to it being my 4th largest holding at the start of the year. 

Individual performance of investments is below:
H1 2020 portfolio performance

The two members of the portfolio I was thinking of selling 6 months ago, I dithered over. As a result Saga and Dignity are still there, albeit very small holdings. I'm in two minds whether to get rid of them, as they are irritants, and I don't regard either as sensible investments. Saga may see a decent bounce if we get good news on the medical front that enables it's cruise ships to set off. One the other hand, they are both very small amounts of cash, so unlikely to have much impact on the overall portfolio whichever way they move.

There are plenty of reasons to be concerned over the state of the markets, with an imminent global recession, US attempts to address the virus seemingly unravelling, a US election, Trumpy's fondness for tariffs, and Brexit. However I suspect all will be ignored if we get good news on vaccines and medical treatments for the virus. Whether that good news is already priced in we will find out in due course...

Thursday, 2 July 2020

June 2020 portfolio update

Lock-down restrictions easing off were a bit of a relief, particularly with temperatures increasing. I'm sure once the pubs re-open we'll all be piling in to share our pathogens over a pint. It only took a couple of days of sunny weather to see south coast beaches overwhelmed with people - my fingers are crossed that we don't cause such a spike in infections that schools close in the Autumn.

Markets seemed a bit fragile in June, perhaps with the huge recovery surge in stocks since the March lows investors are looking over their shoulders a little. But there are a few other reasons of course. Trumpy's polling numbers are headed south, giving Biden a lead which will have a few people on Wall Street wondering if their wallets will look a little less plump. Finger pointing from the US and Europe over potential naughtiness involving Boeing and Airbus led to a list of new tariffs being considered on various obviously airline related products such as gin and olives (?). And Whitehouse insiders couldn't quite make up their minds if the US/ China trade deal was still intact. Oh did I forget the massive increase in COVID-19 cases in the US...

This month cash was split into two investments, part went into an Investment Trust and part into an interesting software company. I've been looking into a few Investment Trusts that add to the diversification of the portfolio, particularly into businesses listed outside of the UK. This month I bought a few shares in a Trust focused on Asian/ Australasian dividends, the thinking being that most countries in which this Trust is invested seem to be doing a better job of managing their COVID-19 outbreaks, so should get their economies up and running more quickly.

As for the rest of the investment cash - it's often suggested to buy what you know, which is what I decided on with the addition of Elecosoft. I saw a name that looked familiar in an online discussion, and after a quick bit of digging found that they own a software business I used to work for. A positive trading update and decent set of accounts helped convince me to buy a few shares.

Portfolio performance
The portfolio was up 0.6% in June, slightly behind my chosen benchmark the Vanguard FTSE All Share Accumulation which was up 1.6% over the same period.

Best performers this month:
Lancashire Holdings +19%
Fulcrum Utilities +17%
888 Holdings +14%

Worst performers this month:
Saga -26%
Abcam -11%
Craneware -9%

June share purchase 1: HFEL
A few shares of the Henderson Far East Income Investment Trust (HFEL) made their way into the portfolio this month. It is run by Janus Henderson, and as the name suggests it's aim is to provide a growing source of dividends. I bought in at roughly the NAV, although given the volatility in the markets at the moment I think that NAVs should be taken with a decent pinch of salt. It gets 3 stars from Morningstar, which I take as pretty positive given that it's aim is income focused rather than capital growth.

The holdings are spread across Asia and Australasia, with over 30% in China. It has a range of sectors, with the largest being Financials and Telecomms, with Oil and Gas thankfully making up just over 1%, it's most notable holding is the semi-conductor giant Taiwan Semiconductor Manufacturing. It has around 2% gearing, and has reserves from which to payout around 9 months of dividends should it need to. The Trust's dividends have grown at around 3% - 4% over the last few years, and with the Spring sell off the yield is around 6% - 7%.

The Asia Pacific companies from which the Trust likes to invest have tended to hold more cash than their European and US counterparts and have been increasing dividend payments over recent years. A relatively low payout ratio should mean that dividend growth can continue, although that remains to be seen given COVID-19 continues to circulate without us having adequate medical responses.

June share purchase 2: ELCO
Elecosoft (ELCO) was also added to the portfolio in June. They are a software business focused on architecture, construction, and property management. It is a relatively small business, with a Market Cap just under £60m. They listed on the AIM in 2006 and have been making solid progress over the past few years.

Around 40% of revenues are generated in the UK, with most of the remainder being made in Europe and further afield. Recent acquisitions bolt onto a portfolio of architectural and construction systems, provide multiple cross-selling opportunities and should provide a useful comprehensive end to end service offering.

Elecosoft have a potentially sticky customer base as evidenced through their impressive cash conversion. Their recent trading update covering business until the end of April showed a reduction in revenues that was outweighed by increases in profit and crucially in renewed subscriptions for support and software. Recurring revenues such as these are a great way to ensure ongoing income.

The accounts look sound with a net cash position as of April. Revenues, profits and free cash have all been chugging higher over recent years. The dividend is relatively small but has been increased at an annualised rate of over 20%, and they have plentiful free cash covering the dividend.

I'm sticking with my approach of taking smaller positions in businesses I think might be higher risk - in this case, due to the small size of the business, I consider this potentially more volatile. There's a chance this could get hit by any COVID-19 downturns, although the balance sheet looks healthy, there's no need to take unnecessary chances, so only a small number of shares bought at this stage.