Showing posts with label Share analysis. Show all posts

Monday 21 December 2020

Price is what you pay


It's traditional towards the end of a year, to look back at what has happened over the past 12 months. So I thought I would take a look at some of the portfolio and how they had faired against similar businesses during what has been a chaotic 2020. In particular I wondered whether some of my larger holdings had become or more less expensive over the year.

But then I figured 2020 has been such an exceptional year, that whatever has happened, it's likely to remain an outlier. Unless we are about to see economies shut down, in whole or in part, over the next few years, 2020 is going to remain an oddity. So I did a complete reversal and started picking over a few stats that specifically excluded 2020.

I keep track of the purchase price of any shares bought, and also a range of financial measures, so that I have a rough idea if in future I might be picking up the shares at a bargain price. Of course cheap vs. expensive is quite a complicated notion when it comes to the stock market, as there are any number of ways to describe this. 

I thought I'd use a few metrics that were relatively easy to understand and see how a range of companies had performed over the 5 years prior to COVID-19, December 2014 - December 2019, and included of a few of the portfolio - Unilever, Glaxosmithkline and Computacenter.

The metrics were:

  • Share price
  • Dividend growth
  • Net profit
  • Basic earnings per share
  • Free cash flow

And a couple of ratios through which to view price:

  • Price / Earnings (PE)
  • Price / Free Cash Flow (PFCF)

 There's a googlesheet here and a summary table below:


It's a pretty high level and incomplete set of information, but looking at the growth of a range of those measures for the 5 years leading up to COVID-19's arrival is interesting. I think I might build this into my usual review of businesses going forward as it has provoked a few neat questions. Anyway, some thoughts below

Unilever

Share price outpacing profits and led to the PE increasingly rapidly. But, free cash flow has been advancing faster that the share price. So investors are being asked to pay more for Unilever's profits, but less for their cash...

The PE is rising at the same rate as dividends – I wonder if Unilever is cementing it's place as a Bond proxy in a world of low interest rates?

Unilever isn't obviously more expensive that it was a few years ago - profits and cash are not rising at the same rate, so depending what you prefer paying for it can be viewed as more expensive...or cheaper.

Diageo

Share price and profits rising at a fairly consistent pace. Dividends a little slower, but still faster than inflation. But the FCF is the really noticeable thing here, moving at a fair clip.

As a result of the consistent growth, the PE, whilst expanding, has increased slowly (at just above the target of many central bank's rate of inflation).  But the PFCF has declined considerably thanks to the rate at which free cash flow has advanced.

Diageo is been a company I've prevaricated over for a while, it's a big, steady consumer  goods business, which I like. But I've wondered whether people are going to simply be more health conscious and booze less going forward. Maybe it needs a closer look.

Glaxosmithkline

The share price has been rising slowly, just above inflation, dividends flat, but profits and FCF have been rising much more quickly. As a result the above price ratios have both been decreasing at similar rates.

Despite the profit and cash measures looking more attractive, there have been more sellers than buyers. So presumably the above doesn't tell enough of the story. Given the pharmaceutical side of Glaxo, maybe the business is selling old products about to fall off a patent cliff. In other words, investors don't see the business creating a pipeline for growth and hence it is less attractive.

So expensive or cheap? Here the trade of between price and value seems very interesting and would need a deeper look into the reasons why investors were not impressed.

 Astrazeneca

Another Big Pharma business, who's numbers above are almost doing the opposite of Glaxo. The share price has been rising fast, but dividends, and profits were flat. We can also see that FCF was falling fast.

We can see that with the numerators growing and denominators shrinking the PE has expanded, and PFCF has exploded. 

Investors are willing to pay more now that a few years ago to own Astrazeneca. Does it have great growth prospects? Maybe it's been pushing all that profit and cash back into the business and is about to rocket. Maybe it has a pipeline of amazing products that are going to push those profits and that cash skywards? I haven't looked, but even without rummaging under the bonnet it's starting to look pricey to me... 

Computacenter

Here the share price, dividends, profits and FCF are all marvellously consistent. And pointing upwards.

So despite the share price bouncing up, the PE and PFCF have hardly moved. Everything is moving in unison.

I invested in Computacenter because they were a long standing supplier for my employer, and always did a good job. Nothing flash, just got the job done. Much like these numbers. My guess is that the market views them as fairly priced, which is why the share price has moved in tandem with the underlying performance of the business.

 EMIS

The share price for EMIS is growing just above it's growth of FCF, but profits are flat.

For the dividend hunters, things might look tempting as this is increasing at 10%+ per year. It could  potentially continue for a while if it continues to generate cash. But the rate of increase of the dividend is double the growth of their cash, so sooner or later it's going to catch up.

Given the flat profits, and increasing price it is now more expensive that it was. Maybe it's those dividend hunters who are willing to pay up to own a consistent dividend? It's difficult to get excited though when a business can't grow it's profits, perhaps given that EMIS is a supplier to the NHS it simply has limited pricing power.

Conclusion

No real conclusion, but an interesting diversion, which provoked a couple of questions of my larger holdings. And gave me some comfort that they remain worth hanging on to. I've looked into Diageo before, and will again. EMIS had some favourable characteristics that drew me to it, but I'm not convinced. Astrazeneca - now this one does look pricey. It may have decent growth prospects, it needs to...I'm priced out of that one. For now, happy investing.

Tuesday 15 September 2020

Solar power investments - 2nd thoughts

Solar power has been a phenomenal success. It's increasing adoption is driving down costs, and generating increasingly cheap electricity. Here is an article that spells this out in convincing detail.

This article from the IEA is suggestive of something similar, although from the point of view of auctions. And this from Irena, suggesting the costs from Solar have been reducing by around 13% per year.

I think the greatest impediment to further adoption of renewables over fossil fuel has been economics. It seems clear that in the case of solar this argument has been won. Solar provides increasingly cheap, cost effective electricity.

Solar investments
I have two investments in solar power in my portfolio, Next Energy Solar Fund (NESF) and Foresight Solar Fund (FSFL). In both cases I assumed these would offer relatively little in the way of capital growth, but that the pedestrian growth will be augmented by a steady flow of dividends. And since the power that these businesses generate gradually increases in price over time, the dividends will more or less keep pace with that level of price inflation.

However, as noted above, solar energy price inflation may not be forthcoming. Quite the opposite. Next Energy Solar recently published their annual report so I was intrigued to read about how they intend to manage a product reducing in price.

Next Energy Solar Fund (NESF)

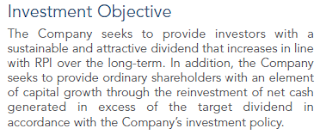
I bought shares in Next Energy Solar Fund (NESF) in November 2019, essentially buying into their investment objective as outlined in their 2019 annual report:

I expected it would reduce the volatility of my portfolio, as it should have steady revenue streams, most of which were backed by Government subsidy. And one reason I like dividends is that they too help reduce portfolio volatility. So it was a typical risk/ reward trade off - lower growth and lower volatility. The KIID implied as much.

At the time 35% - 40% of NESF revenue was not covered by some form of subsidy, and more subsidy free solar development was underway. So this chunk of subsidy free electricity would be subject to the movement of prices on the wider wholesale energy market.

The annual report describes the fund's NAV increasing over 2019 for various reasons, including "...upwards revisions in the forecasts for long-term power prices...". Happy days, unless those power prices go the other way...

Next Energy 2020
I like reading annual reports - it is the chance for the business to put itself in the shop window, and tell the best version of it's story. It is also a more rounded story, with a little more meat than the simple results briefing. It should be convincing, so when it isn't I find it worrisome.

The NESF results weren't great, but not disastrous. NAV down a bit, dividends up a bit. Operationally there were more assets generating more electricity, and a higher capacity. But the Chairman's statement contained the following:


"...power prices and inflation levels have become less correlated..." - which rather matches some of the analysis from the articles linked above. And as a result RPI linked dividends are out of the window, the resulting change to NESF's investment objective has since become "regular dividends":


Subsidy free risk
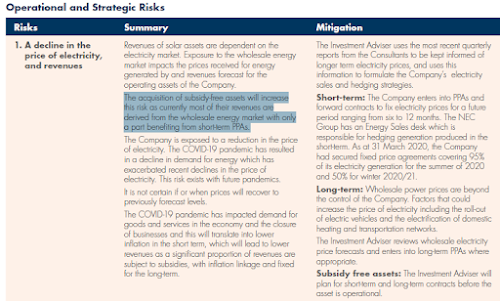
The top "Operational and Strategic Risk" highlighted in the annual report relates to the risk of falling electricity prices: "The acquisition of subsidy-free assets will increase this risk as currently most of their revenues are derived from the wholesale energy market with only a part benefiting from short-term PPAs."

The Chairman acknowledges that 39% of their revenues are without subsidy, and require locking in prices using PPAs:


And that they continue to pursue a subsidy free investment programme, aiming for 150MW by the end of 2020, at a cost of £55m - £80m. Preference shares worth £100m were issued during the year, which I guess is the source of the majority of this cash.

Discount rate
The final bit of irritation was found in their financial KPIs, 

Each year since 2017, the discount rate has been reduced. Since this sits in the denominator of the discounted cash flow they will be using to calculate the NAV, it has the effect of increasing the NAV. Which is mentioned in the discussion of NAV in the annual report:


Unfortunately NESF don't state how they determine the discount rate.

Conclusion
It feels to me as if the business has backed itself into a corner. It's only route to growth being the purchase and development of assets that are generating a product being sold for an ever decreasing profit. Continuing to increase the proportion of subsidy free assets in their portfolio surely can't be sensible, as indicated by their own risk assessment.

Changes to the discount rate have been made without explanation, and since doing this cushions the impact of the falling price of their product, it's not a good look.

I should have identified some of this in my research before purchase. Lesson learnt.


Sunday 8 March 2020

Coronavirus March Meltdown

February and the first week of March have seen a sizeable slice of value taken off of the stock markets, thanks mainly to the COVID-19. Oil prices are taking a hammering and the recent failure of OPEC to come to an agreement to cut oil production is only likely to exacerbate the decline in oil prices. Add in a bit of hard Brexit and there's a pretty potent mix, for the UK markets in particular.

China seems to be slowly coming back online, but we are seeing increasing numbers of infections reported across other regions. In the UK the FTSE has seen a couple of days of selling that appear to be particularly panicked, so I thought it would be interesting to see what has sold off, and by how much. There is a googlesheet here with the data and charts.

The FTSE100 has lost around 13.5% over the last month or so, the red line on the chart below shows the index performance.

Perhaps unsurprisingly travel, miners, retailers and financials are all taking a hit, losing more than the index. Utilities and supermarkets all holding up. I find it interesting to see which businesses have more resilient share prices, and wonder which are getting caught up in the selling, and are unlikely to see much impact from the virus when the dust has settled. Smith & Nephew for example is a healthcare company selling medical devices and wound dressings, and is down 10%.

I also wonder whether those more resilient share prices are actually the companies in which I want to invest. After all if a global pandemic, oil price crash and resurrections of a hard Brexit don't make a dent in the prices, they are probably the sorts of companies I'm after.

Wednesday 23 October 2019

Renewable energy investment trusts

I’ve been monitoring a number of Investment Trusts providing renewable energy for a while but haven’t yet invested in any. The ITs have continued to have a pretty large premium of 10%+, rarely reducing and I haven't been agile enough (or paying enough attention) to catch the infrequent dips. There are also quite a few listed businesses providing interesting and innovative products that could help contribute to some of the solutions to reducing our use of fossil fuels, but many of these are currently small and still trying to scale their products.

Recent activism by groups concerned by human impact on the climate has put this issue front and centre of many news media agendas. This is understandable when you look at some of the consequences of climate change; the Intergovernmental Panel on Climate Change (IPCC) reporting showing the trend of global warming, and it’s likely impact is here. There’s also plenty of material available via Google, I found this McKinsey report interesting.

There has also been an increase in the publication of articles on how investors can adapt their approach to ensure they are helping to be part of the solution rather than part of the problem. Morningstar recently published a number of articles on ESG (Environmental, Social, Governance) themed investing, just scrolling down their news archive shows how often this crops up, and for a while they have offered a sustainability rating for funds. The Guardian has published several articles on the investment world's reaction to climate change. That there is a more general interest can be garnered from Google Trends - a simple search for "ESG" over the last 5 years shows a distinct increase over the last year:

Google trend of term "esg"
Google Trends: use of the term "esg" in google searches.

A few options....
I’m not interested in trying to trade stocks, preferring to invest in businesses. Part of my reason for choosing an investment is usually some sort of long term tailwind behind the business. In other words if the business is likely to be bigger and better in 5, 10 or 20 years into the future, then it might be worth investing. It doesn’t have to take over the world, a sensibly run business that throws off plenty of cash is fine with me.

Renewable energy is a sector that clearly has a tailwind, and the IT's focussed on renewables have a number of characteristics that I find appealing, such as generous dividend yields and low volatility. Renewable energy costs have reduced, so the economics now seem to behind renewables too. But how should I assess the potential benefits and pitfalls of the investment trusts giving such easy access to this sector?

A visit to the AIC website shows 12 ITs that are invested in renewable energy infrastructure:
AIC list of renewable energy infrastructure companies


I think here we have the starting point for assessing how comfortable I would be investing in these. Factors to consider would include:

Premium/ Discount:
This is the difference between the value of the assets (NAV) and the price at which the shares are being bought and sold. This is the main reason for me holding back on investing. If we make the assumption that the share value will move closer to the NAV over time, then buying at a premium is potentially going to impact negatively on returns. Another related statistic is the average premium at which the shares have traded recently - this isn't available above but can easily be found at various places such as Morningstar.

Gearing:
The investment policy of each of these should detail the approach to borrowing and gearing being used by the business. It's really worth digging into the business reporting and accounts rather than the simple summaries above to get the fine details.

Size:
As we can see the value of assets for each trust varies from Gore street at £28m to Greencoat UK Wind at £2.7bn. I think this, along with trading volumes should give a clue as to how volatile the trading and price movements of any such investment might be.

Currency:
A number of these trusts have a part of their portfolio outside of the UK, so may be subject to foreign currency movements and/ or local legal and regulatory changes that differ from the UK. Two of the trusts operate entirely outside of the UK – GRP and USFP, so are more exposed to these factors.

Charges:
Ongoing charges are going to directly impact returns so keeping an eye on these is a no-brainer. Some of the charges above are a little eye-watering.

Something not included at the AIC summaries relates to subsidies and the payment structures that these businesses use. A lot of these have been heavily subsidised, both UK and foreign Government approaches to subsidising these developments could impact these businesses as many of them have already invested beyond the UK.

When it comes to payment structures, chewing through the following acronyms: ROC, CFD, FIT, PPA could give you a little indigestion. Power Purchase Agreements (PPAs) help to reduce the volatility of wholesale electricity prices which as you see below can move around a bit:
UK wholesale electricity prices

Ofgem have a number of useful links for understanding the above - of particular interest should be Renewable Obligation Certificates (ROCs).

Other potentially interesting businesses that I have taken a look at are below:

AFC Energy - developing fuel cell technology to use hydrogen to generate electricity
Aggregated Micro Power Holdings - operates renewable energy facilities and finances various decarbonisation projects
Ceres Power - developing fuel cell technology to use various sources including ethanol and hydrogen.
ITM Power - developing technology to use hydrogen as an energy source
John Laing Group - infrastructure investment including renewables
Kingspan Group - manufactures a range of sustainable products for the construction industry
Powerhouse Energy - developing technology to use waste plastics for electricity and hydrogen production
SIMEC Atlantis Energy - renewable energy provider
Nexus Infrastructure - energy infrastructure provider including electrical vehicle charging
Fulcrum Utilitilies - Another energy infrastructure provider including electrical vehicle charging
Terry Smith also has a version of his famous Fundsmith now with an ESG flavour, which I only recently noticed.

I have a small position in Fulcrum Utilities, keeping an eye on the rest.

If anyone is particularly interested in investing in companies contributing to renewable energy I suggest checking out the diyinvestor blog for some excellent reading material.

Saturday 27 July 2019

Dividends vs. drawdowns

Dividends vs. drawdowns
I read this Terry Smith article some time ago (also available on the FT site here), and thought I should finally get around to digging into it a bit more. I think you can question the merits of using price to book as an appropriate metric, particularly with low capital companies who generate cash with few physical assets. I’m sure you could also disappear down a rabbit hole attempting to analyse retained earnings for a bunch of companies, particularly a disparate collection such as those in Fundsmith. But I am most interested in the distinction between using dividends for an income stream versus selling fund units (or one’s shares) as a means to generate income - to quote the article:

"The need to get spending money from your investments once you've retired is obvious. But why does it have to come from dividends?"

If I had an investment that paid out 4%, something like a FTSE 100 tracker, how would taking the 4% dividend compare to selling units to generate the same income? The FTSE 100 hasn't performed particularly well over recent years compared to other indices, whereas in terms of capital growth Fundsmith has been one of the better places to park your cash. It's only a small sample, but comparing these two investments, let's see how Mr Smith's assertion stacks up.

Income dilemma
I’m starting from a position that I need my investments to provide me with some income. There are two ways I can generate this:
  • Have an investment that pays out a steady dividend
  • Sell a slice of my investments at regular intervals
I’m going to take the FTSE 100 as my initial virtual investment – or more precisely a couple of iShares index funds to compare, one an accumulation fund that automatically reinvests dividends, one a distribution fund that pays out dividends quarterly.

I begin with an imaginary £100000 (just because it's a nice round number). I have wound back the clock to January 2010 when the accumulation fund I’ve chosen was started, and tracked performance forward from there until the end of June 2019. To make life easier I’m ignoring fees.

The capital of the distribution fund will remain untouched, and the dividends are not reinvested. For the accumulation fund I will sell as many units as I need to generate the same income provided by dividends from the distribution fund. I will also sell these units in the same months as the dividends are paid out.

Lets start with some stats showing how the trackers performed before I sell any units.

FTSE 100 accumulation tracker:
  • Starting value January 2010: £100000
  • End value June 2019: £200829
  • Total return % change: 101% increase
  • Total return: £100829

FTSE 100 distribution tracker:
  • Starting value January 2010: £100000
  • End value June 2019: £140647
  • Capital % change: 41% increase
  • Dividends paid: £43941
  • Total difference (capital + dividends): 85% increase
  • Total return: £84588

As might be expected, dividends being reinvested automatically into the accumulation fund, and the wonders of compounding provide for a much better performance. The additional 16% that the accumulation fund provides sounds a little abstract, but an additional £16k in the bank certainly isn’t.

But I need an income, so how does the accumulation tracker compare as an investment if I need to sell off quarterly slices in order to pay the bills?

Accumulation tracker:
  • Starting value January 2010: £100000
  • End value June 2019: £141389
  • Capital % change: 41% increase
  • Total value of units sold: £43941
  • Total difference (capital + dividends): 85% increase
  • Total return: £85330

In other words, generating an income through dividends, or taking a slice of the fund gives pretty much the same result. Changing the timing of unit sales would affect the returns, but if this was my income I wouldn’t necessarily be able to delay paying bills to wait for a favourable price at which to sell units.

This also doesn’t take into account fees, for the two funds I’ve chosen the ongoing charges are the same, but depending on the platform in which you choose to invest, transaction fees would nibble away at the small advantage that the accumulation fund offers. There is also the hassle of having to sell the units etc. not a big deal maybe, but compared to simply receiving a quarterly dividend in your bank account, it’s an effort that can be avoided.

So it doesn't look like the assertion from the article above holds much water in this particular example. At the time of writing the FTSE 100 ETF has a yield of 4.4%, and as can be seen here, aside from the financial crash years around 2009, the current yield is at the upper end of it's historic range. Fundsmith Income fund has a much lower yield of around 1.5%. Lets see how the Fundsmith accumulation fund would fare providing the same income as the FTSE 100 tracker, if I had to sell off units of Fundsmith.

Mr Smith vs the index
Fundsmith launched in November 2010, 10 months or so after the launch date of the iShares accumulation fund above, so I will adjust the unit sales to match. Basic stats as above to start with:

Fundsmith accumulation:
  • Starting value November 2010: £100000
  • End value June 2019: £453020
  • Total return % change: 353% increase
  • Total return: £353020

Now if I sell units to provide for the same dividend income as the FTSE 100 distribution tracker above we get the following:
  • Starting value November 2010: £100000
  • End value June 2019: £360616
  • Capital % change: 261% increase
  • Total value of units sold: £41444
  • Total difference (capital + dividends): 302% increase
  • Total return: £302060

Even when Fundsmith has to pay out an additional few percentage points in income to match the FTSE 100 ETF the differences are pretty stark. Selling the units would give the same income as the tracker, but the capital is up over 260% compared to the 41% of the tracker. Using this second example, the approach outlined in Mr Smith's article appears convincing.

Friday 12 April 2019

Diversification - Japan


Geographical restrictions
Currently my portfolio is entirely invested in businesses listed in London, although they are mainly large international businesses, which have only a small proportion of their revenues from the UK. The list of companies I would be comfortable investing in is also drawn almost entirely from the London indices at the moment. I want to focus on quality businesses irrespective of their location, and am gradually adding to the list of potentials with some US based additions. Whilst I have some grasp of what's happening in the US and Europe, I'm less familiar with businesses listed on Asian indices. Since the US and Europe are potentially easier to purchase on my current ISA platform, and Asia more difficult, I’ll take a look at some alternatives to see if there are any attractive funds, investment trusts or ETF’s available. I’ll start with Japan.

Going passive
The simplest first option would be to put money into a passive tracking fund, something that simply tracks the performance of an index.

There are two indices of note in Japan – the Tokyo Stock Price Index, known as the TOPIX, and the Nikkei 225. The TOPIX is like the FTSE, in that it ranks it’s constituents based on market capitalisation, whereas the Nikkei ranks it’s 225 members according to price (using the Japanese Yen). The difference being that the Nikkei gives a greater weighting to higher priced stocks, whereas the TOPIX is influenced by higher capitalisation companies.

So what sort of easily accessible trackers are there for these indices? A quick rummage on the internet found a cheap Vanguard offering but tracking the MSCI Japan index rather than either the TOPIX or Nikkei. The MSCI provides a number of tools, analytics and (of most relevance here) - benchmark indices that institutional investors can use for measuring performance of their funds. According to the MSCI Japan Index documentation, the index is "...designed to measure the performance of the large and mid-cap segments of the Japanese market..." and covers around 85% of the market.

The Vanguard tracker accumulation fund has an ongoing charge of 0.23%, and according to the performance data they provide, over the last 5 yrs would have turned a £10000 investment into £16633 (in March 2019), a 66% increase, which is an annualised return of around 11%. I'll take this as my benchmark and see if there are other funds out there fishing in this pond that offer a better return.

Funds
There are more funds offering some sort of investment action in Japan than is sensible - 76 on offer from my current ISA provider. In order to restrict this a little I’ll take only the accumulation version of the funds (i.e. dividends are automatically reinvested into the fund), and only those with a rating from Morningstar (this tends to exclude newer funds). Based on the on the annualised return over 5yrs gives me the following 5 funds at the top of the list:
Fund name
5yr annualised return (%)
Ongoing Charges (%)
Legg Mason IF Japan Equity X
23.55
1.02
Bailey Gifford Japanese Small Co B
22.07
0.63
Lindsell Train Japanese Equity B
17.78
0.79
JPM Japan C
17.33
0.90
Bailey Gifford Japanese B
15.60
0.63

All of the above have a Morningstar rating of 5 stars, and all have a KIID risk rating of 6

If I make the assumption that the annualised returns and charges are going to remain roughly the same, I will subtract the charges from the annualised return to give a "Charge adjusted return":
Fund name
5yr annualised return (%)
Ongoing Charges (%)
Charge adjusted returns (%)
Legg Mason IF Japan Equity X
23.55
1.02
22.53
Bailey Gifford Japanese Small Co B
22.07
0.63
21.44
Lindsell Train Japanese Equity B
17.78
0.79
16.99
JPM Japan C
17.33
0.90
16.43
Bailey Gifford Japanese B
15.60
0.63
14.67

Quite a range of returns. Just for fun I’ll add in the total returns based on the charge adjusted figures:
Fund name
Charge adjusted returns (%)
Total returns (%)
Legg Mason IF Japan Equity X
22.53
176
Bailey Gifford Japanese Small Co B
21.44
164
Lindsell Train Japanese Equity B
16.99
119
JPM Japan C
16.43
114
Bailey Gifford Japanese B
14.67
98

So at the top of the table, Leg Mason would have turned every invested £100 into £276, whereas Bailey Gifford Japanese would have the same £100 into £198. Doesn’t take a genius to see which investment is preferable, so two funds moving into position as favourites.

The fund managers have been in charge for different periods too:
Fund name
Total returns (%)
Mgr start date
Legg Mason IF Japan Equity X
176
1996
Bailey Gifford Japanese Small Co B
164
2015
Lindsell Train Japanese Equity B
119
2004
JPM Japan C
114
2012
Bailey Gifford Japanese B
98
2016

I wonder if it is coincidence that that best performing fund has had the same manager for the longest period? The dates also suggest that the two Bailey Gifford funds have had a relatively recent handover, so any credit/ blame for the fund performance should be directed at the managers’ predecessors rather than current incumbents. A plus mark for Lindsell Train in that regard having been in charge of their fund for considerably longer.

And finally if I want to invest in an actively managed fund, I’m paying the fund manager to put my cash into the businesses that they see having the best return on investment both today, and going forwards. I’m expecting them to have selected a relatively small number of businesses – having a massive fist of different businesses doesn’t strike me as helpful – I might just as well get myself a cheap tracker fund and save myself some money on charges. I’m completely ignorant about the state of the Japanese economy, but I’d rather any funds I invest in are in more defensive companies, such as consumer goods, healthcare, and in tech, rather than, for example in highly cyclical companies or commodities. My preference would be for a fund to build it’s portfolio, then leave it alone for compounding to do the heavy lifting. Here's how the funds' portfolios breakdown across sectors:  
Fund name
Sectors invested (%)
Number of holdings
Consumer Defensive
Healthcare
Technology
Total
Legg Mason IF Japan Equity X
17
18
24
59
44
Bailey Gifford Japanese Small Co B
5
11
35
51
71
Lindsell Train Japanese Equity B
41
21
24
86
23
JPM Japan C

16
6
25
47
53
Bailey Gifford Japanese B

3
9
12
24
39

Two funds clearly stand out here:
  • Lindsell Train investing in only 23 companies, of which 86% of their fund is in Defensive/ Health/ Tech holdings
  • Bailey Gifford Japanese are only invested 24% in Defensive/ Health/ Tech holdings.

Based on this bird’s eye view of these funds I’m losing three of them. JPM and the two Bailey Gifford funds. Leg Mason, and Lindsell Train have experienced managers at the helm; I don't consider the Leg Mason portfolio of 44 companies excessive in number and it’s difficult to argue with their returns. The portfolio structure of Lindsell Train appeals but it does lag Leg Mason, however, if either the global economy or the Japanese economy has a few wobbles, Lindsell Train would appear to have positioned the fund to cope. Whereas Leg Mason may require an amount of chopping and changing. Leg Mason has the highest ongoing charges, which would likely increase if there needed to be a bit of buying and selling, however, Lindsell Train have a cheeky 4% initial charge – so just buying into the fund would leave me down 4% (not taking into account broker fees etc.) – maybe not a big deal with a longer term investment horizon, but unnecessary in my view.

To return to the Vanguard benchmark tracker, the 66% return on offer doesn’t really stack up against the two above funds – Leg Mason making nearly 3x and Lindsell Train 2x the tracker returns.

Investment Trusts
The final area to check out is that of Investment Trusts, now I know the performance of some of the funds against which the Investment Trusts are competing, I can narrow the search a little more. Two offering higher returns are both run by Bailey Gifford:
Fund name
5yr annualised return (%)
Ongoing Charges (%)
Charge adjusted returns (%)
Bailey Gifford Shin Nippon (BGS)
25.35
0.76
24.59
Bailey Gifford Japan (BGFD)
19.13
0.73
18.4

Both trade on a small premium of around 4% (i.e. the cost of a buying a share in the Trusts is around 4% higher than the Net Asset Value (Assets – liabilities)). This isn’t massively different from the average premium for the last 12 months, so I’ll make an assumption that this is going to remain fairly stable and not impact any investment. So both Trusts look like they have put in a decent performance that is comparable to the funds above, outperforming the Lindsell Train offering for example, by putting in a total return over 5yrs of 200% for BGS, and 133% for BGFD.

The manager of the BGFD team retired in 2018, with her deputies now running the Trust which is invested in 70 businesses, whereas BGS has had the same manager in charge since 2015 and is invested in 74 businesses. Whilst I don’t really see the need for such a large number of holdings both teams have outperformed the tracker fund by some margin. Given my preference for more defensive businesses and tech over some other sectors, here’s how the two trusts fair:
Fund name
Sectors invested (%)
Number of holdings
Consumer Defensive
Healthcare
Technology
Total
Bailey Gifford Shin Nippon (BGS)
6
13
32
50
74
Bailey Gifford Japan (BGFD)
2
8
22
32
70

Both Trusts would have been great investments over the past few years, but the change in management leaves me a little uneasy. On balance, I think I’d want to see the performance of these teams under the new management for a little longer before committing any cash. However, I’ll keep an eye on both, and should either develop a discount I may get tempted.

Conclusion
The two favourites for a bit more research are Legg Mason and Lindsell Train. Both have long standing management that have delivered a decent return, and significantly outperformed my tracker benchmark. Both managers appear to prefer a longer term investment horizon and preach patience over churning their portfolio. And both have fees that are unappealing in some regard. I’m off for a cup of tea and a ponder.